The question 01
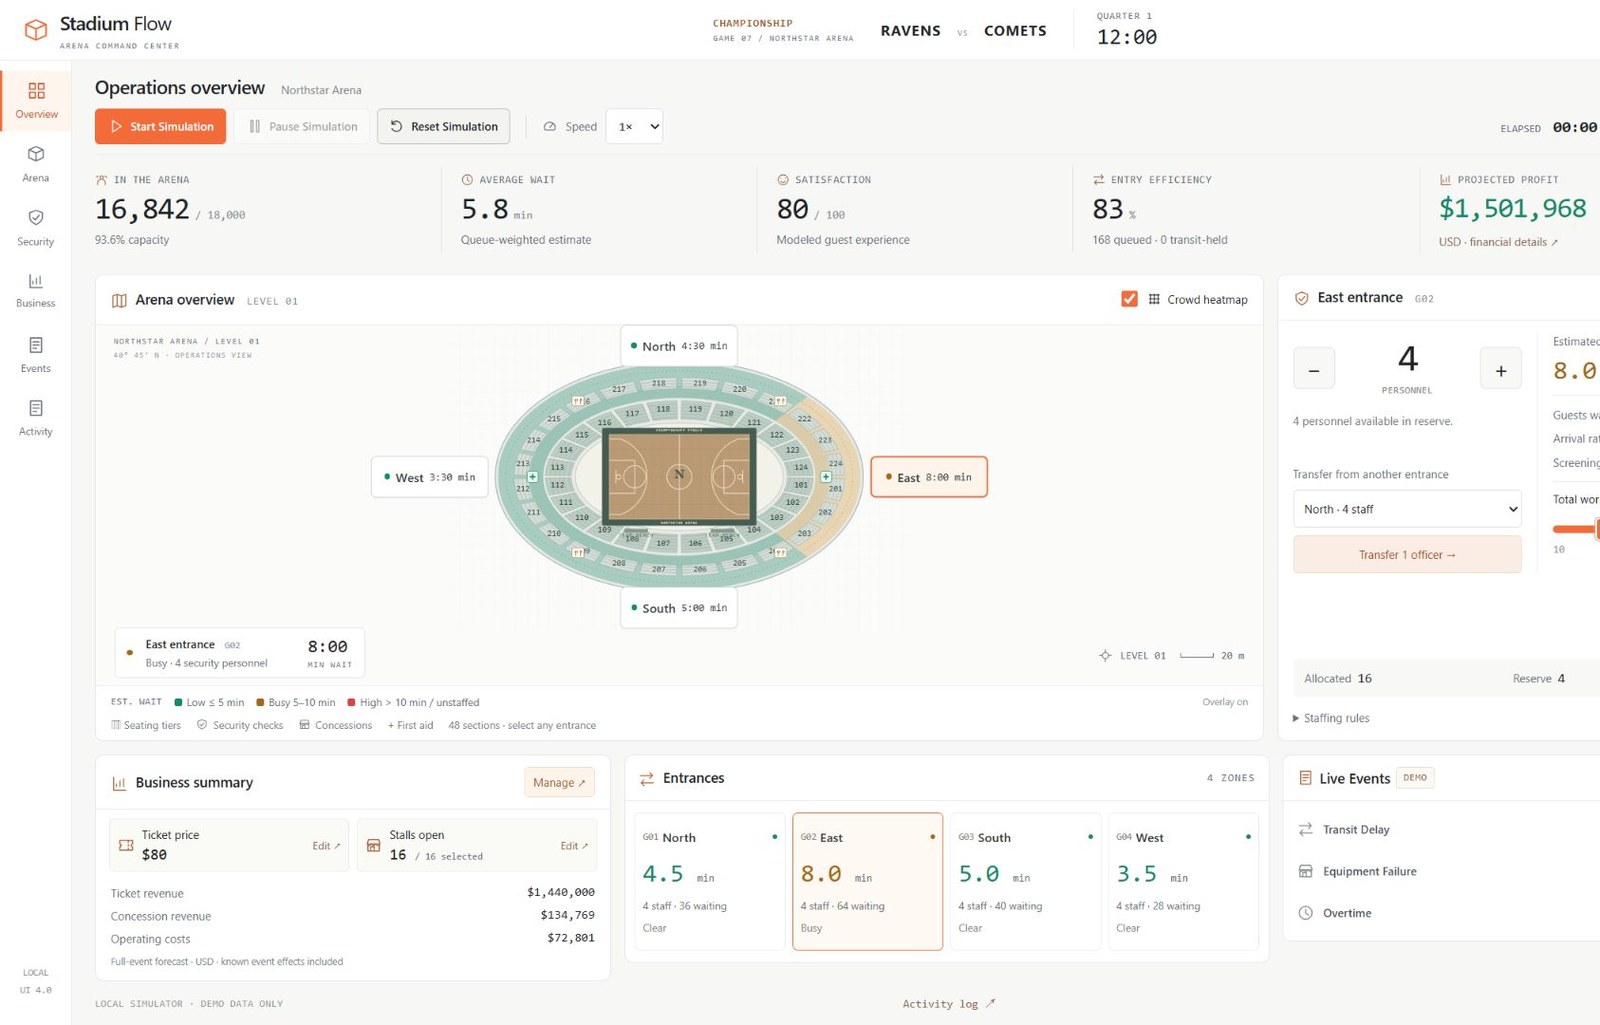
The project explores trade-offs between entrance staffing, ticket demand and operating costs. For example, moving staff to one gate reduces the available reserve, while changes in ticket pricing affect demand within the model.
The version shown here is a local React and TypeScript prototype with one event scenario, four entrances, staffing controls, financial calculations and three scheduled incidents. It uses simulated data rather than a live venue feed. This case study describes the version documented in the October 2026 project records.
What it models 02
The simulation advances in elapsed event time, with admission queues at each entrance and arrivals linked to ticket sales. Its design is intended to produce consistent results at different playback speeds; the recorded checks include equivalent 1× and 60× runs.
Assumptions, stated in the interface
- Capacity: ticket demand is capped at 18,000, with a model constraint limiting queues to unscreened ticket holders.
- Entrances: North, East, South and West, each with staff, a reserve pool, a wait time and a crowd-heatmap reading.
- Concessions: 0–40 stalls, 0.55 orders per sold ticket over the regulation event, $18 per order.
- Costs: $24,000 fixed overhead, $30 per security person/hour including reserve, $90 per operating stall/hour, food supplies at 35% of food revenue.
These are demonstration assumptions rather than estimates from a real venue. They make it possible to explore how queues, resource allocation and recorded costs interact within a fixed scenario.
The business layer 03
Before the clock starts you set a ticket price between $25 and $200 (default $80) and choose how many concession stalls to open. Demand, projected sales and projected profit update together, so the trade-off is visible before anything is booked.
Once the simulation starts, ticket revenue is booked once and variable revenue and costs accrue with the clock. Changing resources affects future accrual only — never past transactions. Pause freezes the recorded ledger while still letting you preview the rest of the event.
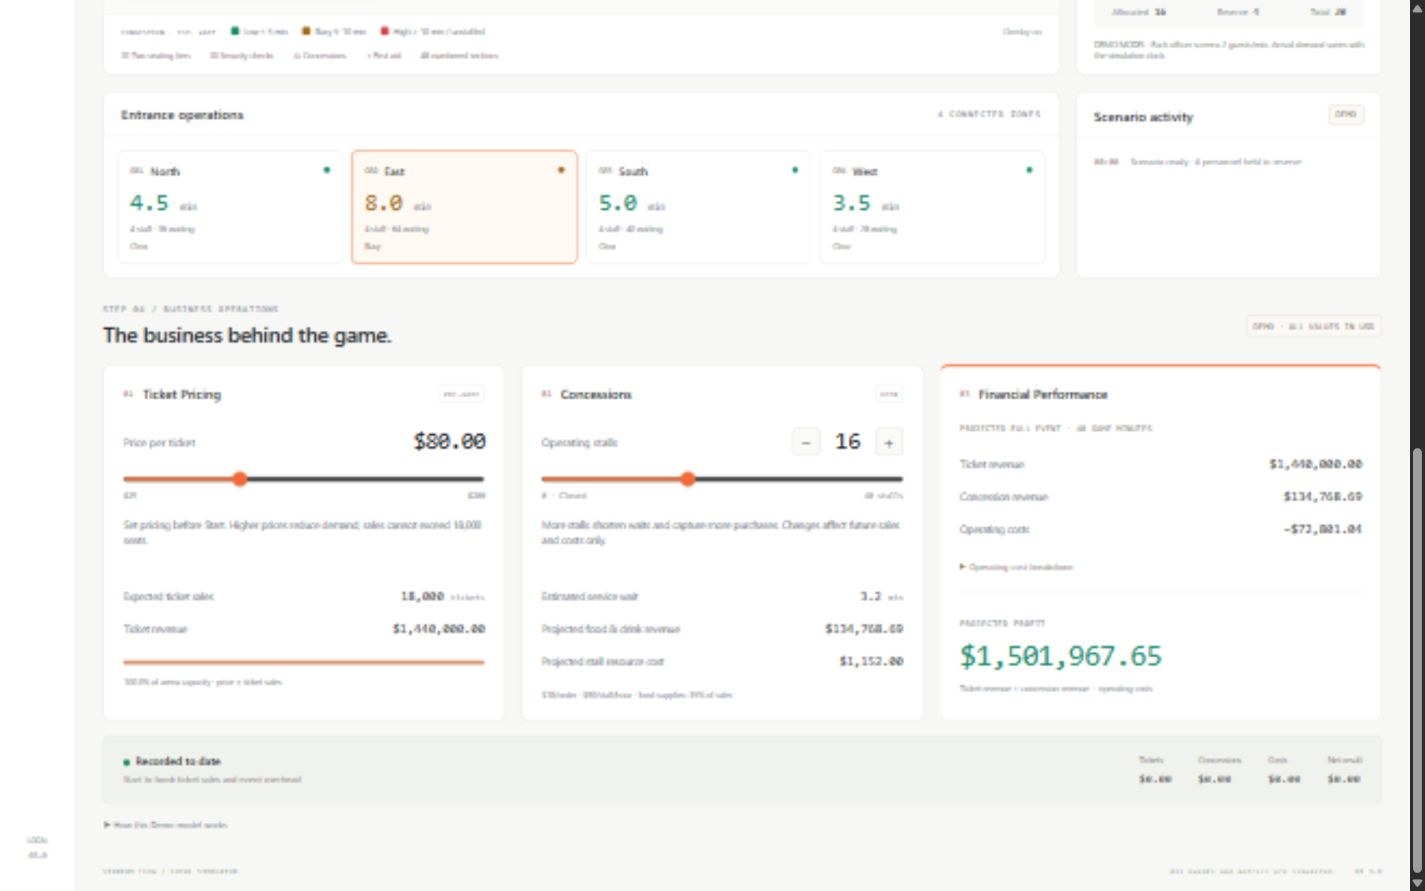
Financial totals use integer cents. Projections combine recorded results with remaining-event calculations at the current settings; matching the final projection to the recorded ledger is one of the model’s validation conditions.
Three incidents, two answers each 04
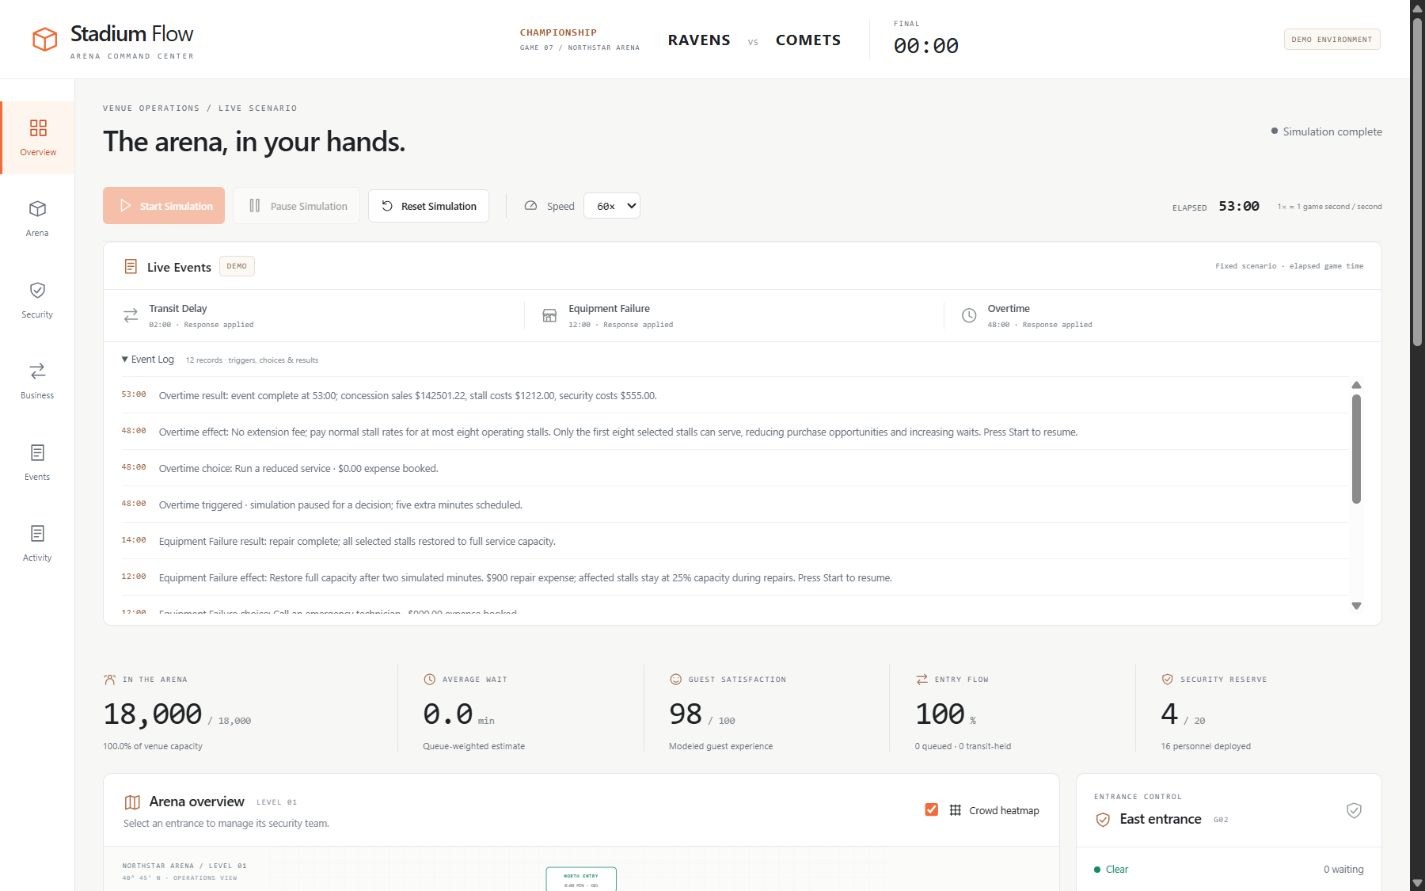
A fixed scenario interrupts the event three times. Each incident pauses the simulation at its exact timestamp and offers two responses with different costs and different consequences.
| Time | Incident | Response A | Response B |
|---|---|---|---|
| 02:00 | Transit delay | $1,800 shuttle routing; held arrivals released at 04:00 across all gates | No fee; held arrivals released at 06:00 as an East-entry surge |
| 12:00 | Equipment failure | $900 technician; four stalls at 25% capacity for two minutes, then full recovery | No fee; stalls recover to 50% capacity and stay impaired to full time |
| 48:00 | Overtime | Five extra minutes, all stalls open, $600 fee and 2× stall pay | Five extra minutes, at most eight stalls, normal stall pay, no extension fee |
Overtime always extends the event to 53:00, runs at 60% of the regulation purchase rate, and pays available security at 1.5×. Every trigger, response, fee and completion is written to a separate event log, kept apart from the short activity feed.
A decision under constraints 05
The transit-delay incident illustrates the management question behind the interface: when is an immediate expense justified by a possible service benefit? The comparison below follows the documented scenario rules. It is not a newly measured performance result.
| Response | Direct response cost | Arrival pattern | Trade-off to investigate |
|---|---|---|---|
| Arrange shuttle routing | $1,800 | Held arrivals released at 04:00 across all gates. | Earlier, distributed arrivals may ease a concentrated queue, but incur an immediate cost. |
| Wait for delayed arrivals | No response fee | Held arrivals released at 06:00 as an East-entry surge. | Avoiding the fee may increase pressure on one entrance; the outcome depends on available screening capacity. |
How to compare the choices
A controlled comparison would keep ticket price, staffing and concession settings the same, changing only the incident response. Relevant outcomes would include queue length, waiting time, reserve staffing and the final simulated ledger. Neither the response fee nor projected profit alone is enough to describe service quality.
No percentage reduction in waiting time or improvement in profit is claimed here. Those outcomes would need to be recorded for the paired runs before recommending one response within the model.
Verification and limits 06
The model is split so that the maths can be tested without the interface: simulation.ts owns state transitions and second-by-second integration, business.ts owns demand, accrual and projections, and live-events.ts owns the schedule and modifiers. The React components only present state and dispatch input.
Recorded validation — 14 October 2026
- The validation record reports 65 business checks and 65 live-event checks passing, alongside the existing staffing regression tests.
- Event tests cover both responses for every incident, exact boundaries, pause, reset during and after an event, invalid or duplicate responses, transit population conservation, repair timing, overtime wages, financial reconciliation and equivalent 1×/60× replay.
- The same record reports a successful TypeScript/Vite production build and browser checks at 1920×1080 and 1440×900 without horizontal overflow. These results refer to that version, not to later changes.
Limits
- Cost and demand figures are demonstration assumptions, not market estimates.
- No persistence: reloading the page starts a fresh scenario.
- The prototype covers one event scenario and has not been validated as an operational planning tool for a real venue.
Further study 07
Before drawing conclusions about a real venue, the model would need evidence beyond software checks. The following steps are proposed for further work.
- Check the operating assumptions. Obtain permitted observations or practitioner feedback on arrival patterns, screening rates, staffing arrangements and costs.
- Test sensitivity. Vary the demand and service assumptions to see whether a preferred response changes. A decision that depends on one untested setting should be treated cautiously.
- Record paired scenarios. Compare the two incident responses under the same starting conditions, preserving queue, service and financial results.
- Observe use. Ask a venue practitioner or relevant student to work through a scenario, then document where the interface or assumptions cause confusion. No user-study results are currently claimed.
This separates three questions: whether the code follows its specified rules, whether the assumptions resemble a venue, and whether the interface helps someone reason about a decision. The existing validation record primarily addresses the first.