The design problem 01
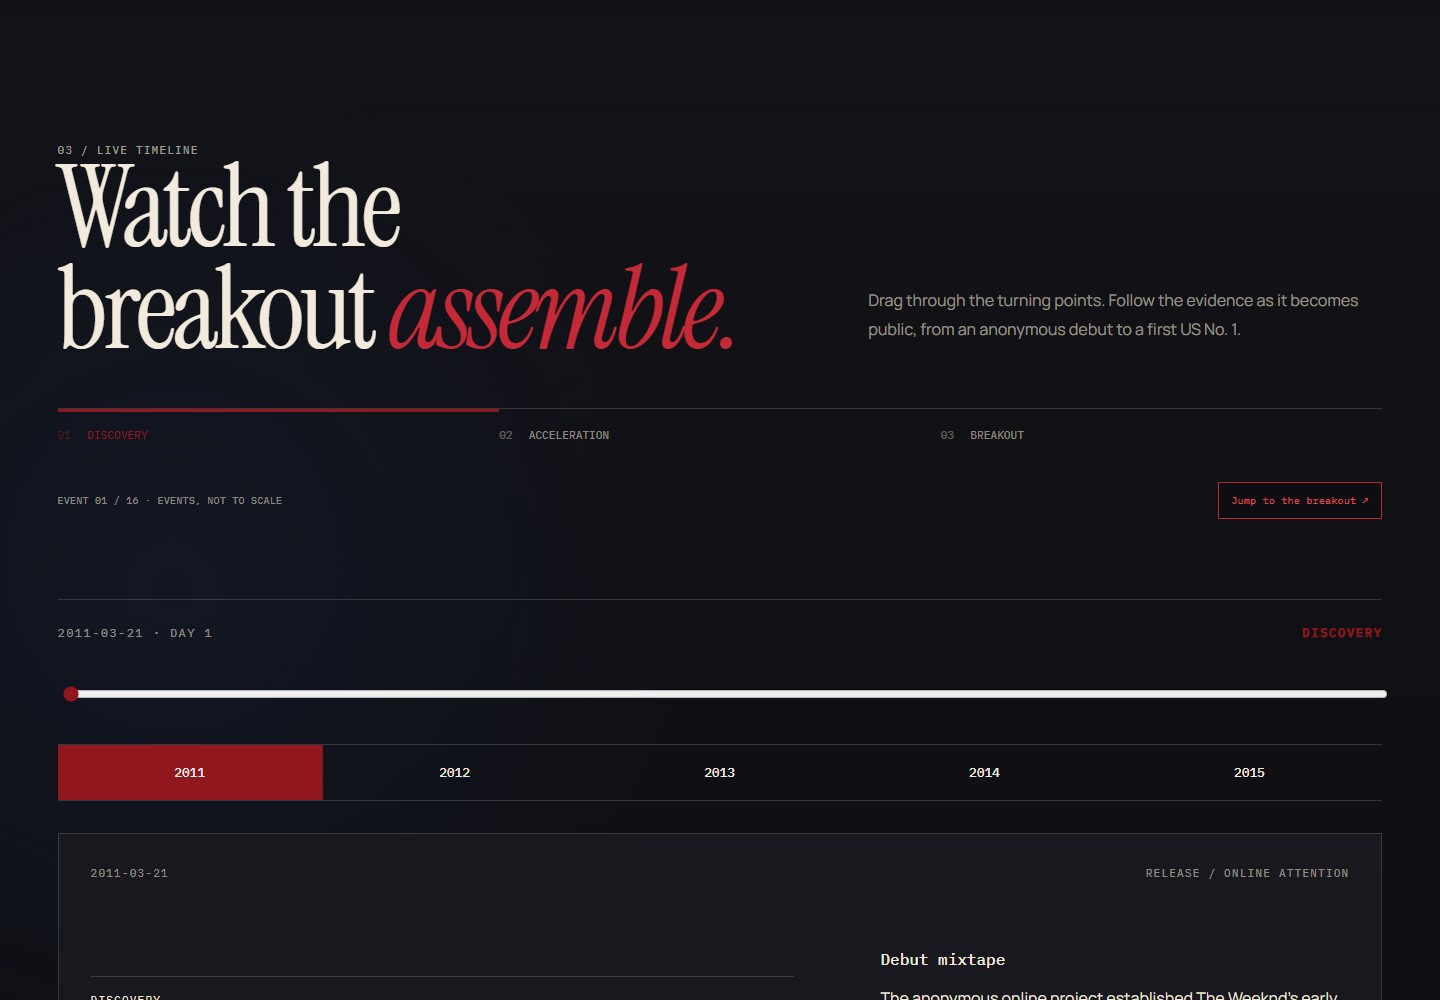
A release timeline and a growth chart offer different ways to present an artist’s career. This project explores how to build a narrative without implying a continuous measured trajectory where comparable historical data is unavailable.
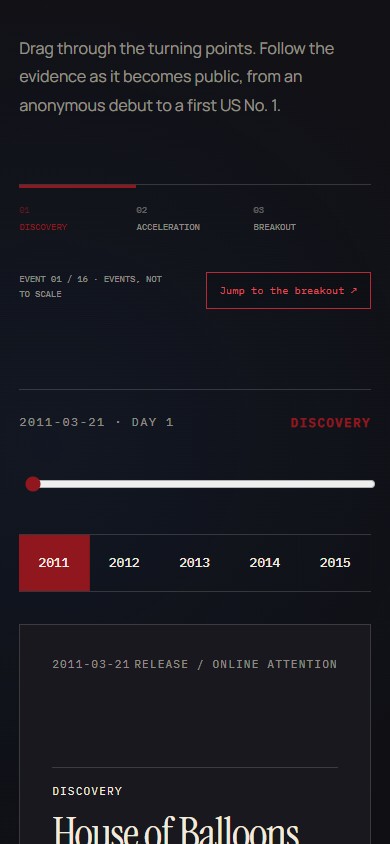
Dated events structure the narrative, with a separate layer for numerical observations and their sources. The guiding question is what had become publicly observable at each point in the timeline.
An editorial system 02
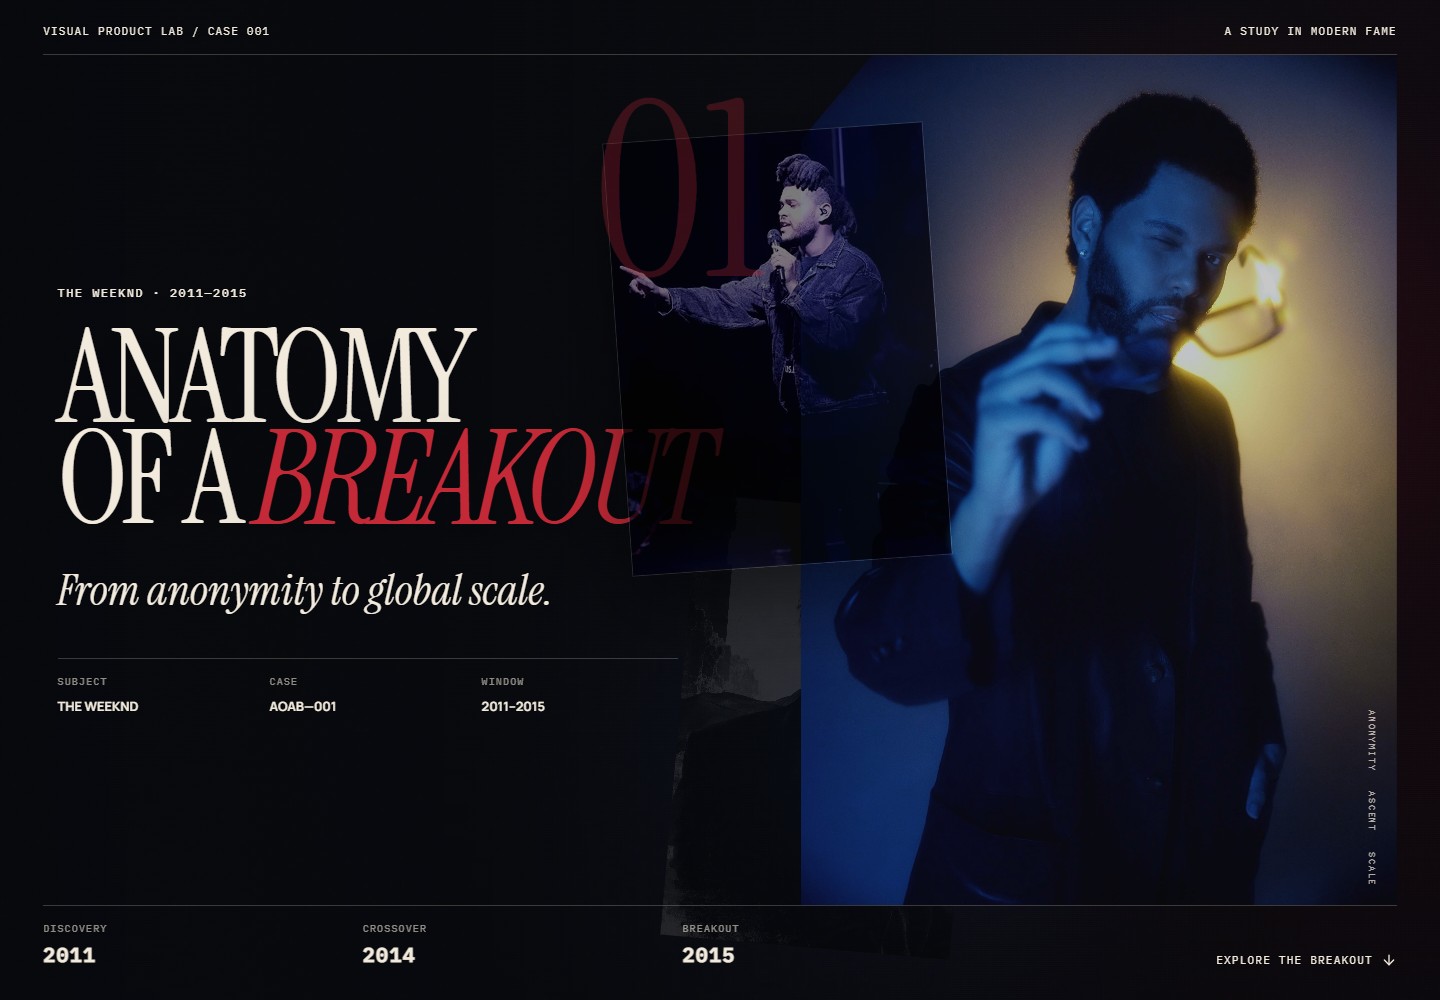
Charcoal, blue-black and deep red establish a restrained campaign identity; warm cream is reserved for type and fine rules. Instrument Serif supplies headlines, a neutral grotesk carries the reading text, and a mono face distinguishes dates, units and controls.
The interface moves through discovery, acceleration, an event-spaced timeline, a chart-topping milestone and subsequent career developments. Consistent navigation is intended to help readers follow these sections.
Evidence that arrives in time 03
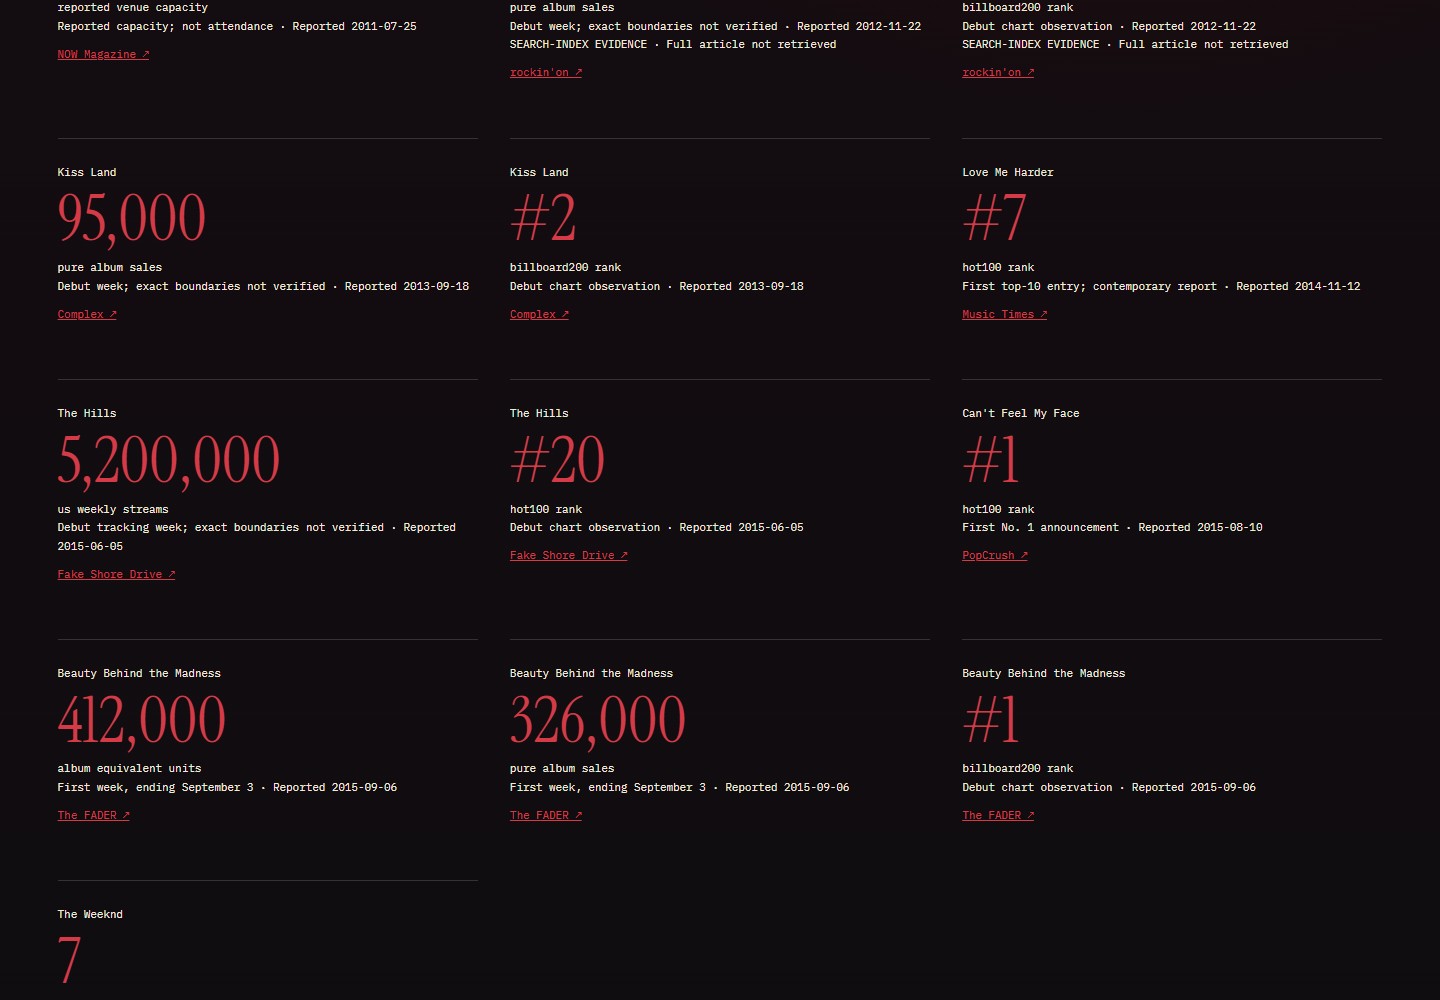
The reconciled master supplies 16 events. A separate evidence layer holds 13 numerical observations backed by nine source records, and every event keeps its source links attached to the corresponding narrative.
The interface distinguishes venue capacity from attendance, reported streaming activity from Spotify-specific listening, and album-equivalent units from pure sales.
The interface uses report dates to determine when numerical observations become visible, so first-week results appear after the release date. Two early observations rely on a searchable contemporary excerpt; the cards note that the full article was not retrieved.
The anchor 04
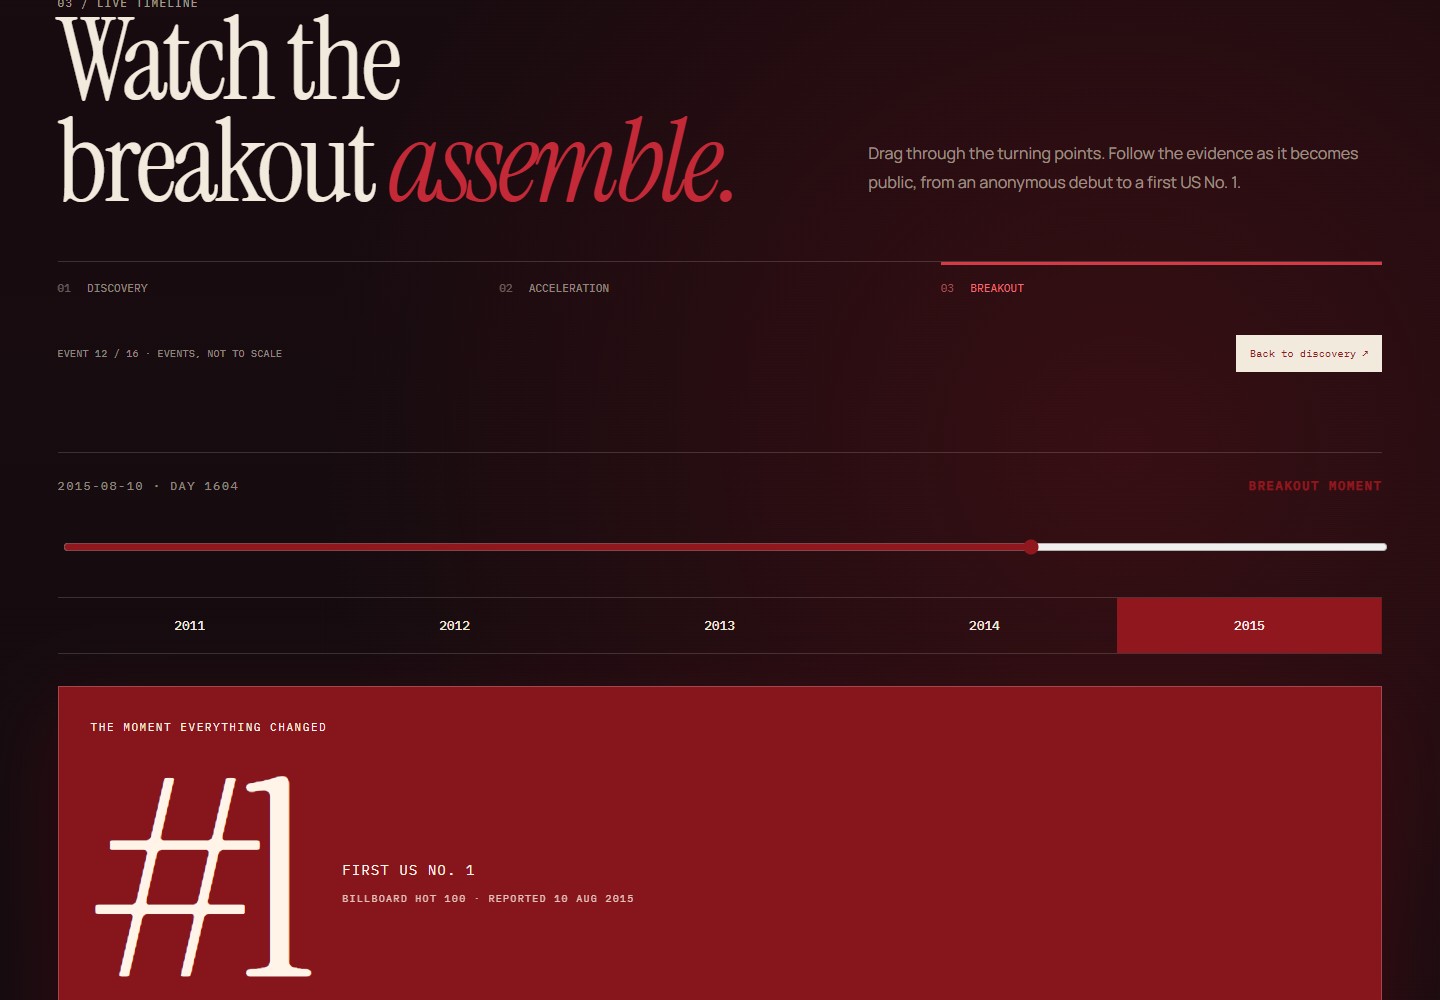
10 August 2015 — the first reported Hot 100 No. 1 for Can’t Feel My Face — is the chosen editorial moment. The interface shifts to deep red and reveals a single large #1. DAY 1604 ties that moment back to the start of the study, so the distance travelled is legible without a chart.
The acceleration graphic is labelled as a schematic rather than a measured curve. This distinguishes the visual interpretation from the numerical evidence.
Editorial choices 05
| Choice in the project | Purpose | Limit to preserve |
|---|---|---|
| Use a chart milestone as the narrative anchor | Provide a dated reference point that the interface can express. | The selected milestone is an editorial definition, not a complete explanation of the artist’s success. |
| Space the timeline by event | Give each event room for its narrative and source material. | Equal visual spacing does not represent equal elapsed time. |
| Reveal observations by report date | Keep later knowledge separate from what was available at an earlier point. | Publication dates and event dates answer different questions. |
A further evaluation would ask readers to distinguish documented observations from editorial interpretation after navigating the study. This has not yet been tested with readers.
Follow-up evidence and its limits 06
A second No. 1, a No. 1 album and Grammy recognition support different kinds of follow-up evidence. None of them supplies listener cohorts, so the final section labels 30/60/90-day retention NOT MEASURED.
Historical Google Trends and YouTube series were not included because a reproducible dataset at the intended scope was not obtained. These gaps remain distinct from measured values of zero.
Delivery and validation 07
The October 2026 project record describes a standalone HTML/CSS/JavaScript build with local fonts and embedded data, suitable for opening from disk or serving on static hosting. It records desktop, tablet and mobile layout checks, together with twelve automated checks covering date boundaries, missing data, repeated navigation and export consistency. These are results for that recorded version.
Scope
- A portfolio prototype. The scope does not include a complete historical platform dataset, cohort-retention analysis or a production deployment.
- The source record describes the hero photograph as material for private local presentation, with source and credit recorded. It does not establish a licence for public reuse.
- No user-study results or product-impact metrics are claimed.