Question 01
This project examines the relationship between opening-weekend and final North American gross across a selected sample of wide releases. It also compares final-to-opening multipliers by franchise status, genre and release timing.
The multiplier provides an additional way to describe a film’s theatrical run beyond its opening weekend. These comparisons are exploratory and do not establish a forecasting rule.
Data and cleaning 02
The dataset contains 150 wide releases from 2023 through 2025, with 50 films per year and at least 600 opening theatres per film. The workbook retains raw source values alongside cleaned fields and derived measures to support review of the analysis.
Work performed
- Standardised distributor names and film attributes across the three year cohorts.
- Built derived metrics: final-to-opening multiplier and opening gross per theatre.
- Documented missing and unusual values rather than silently imputing them.
- Recorded data-quality checks and the geographic definition used throughout.
- Preserved the raw source table as a separate, untouched sheet.
Method 03
The analysis is presented in Excel. The accompanying materials include Power Query M cleaning queries, DAX measure definitions and a Power BI build guide. The report interface is demonstrated in an HTML preview; a native Power BI file is not included.
The analysis uses descriptive comparisons of median multipliers by franchise status, genre and release month, together with a Pearson correlation for the sample. It does not include out-of-sample forecast validation.
Findings 04
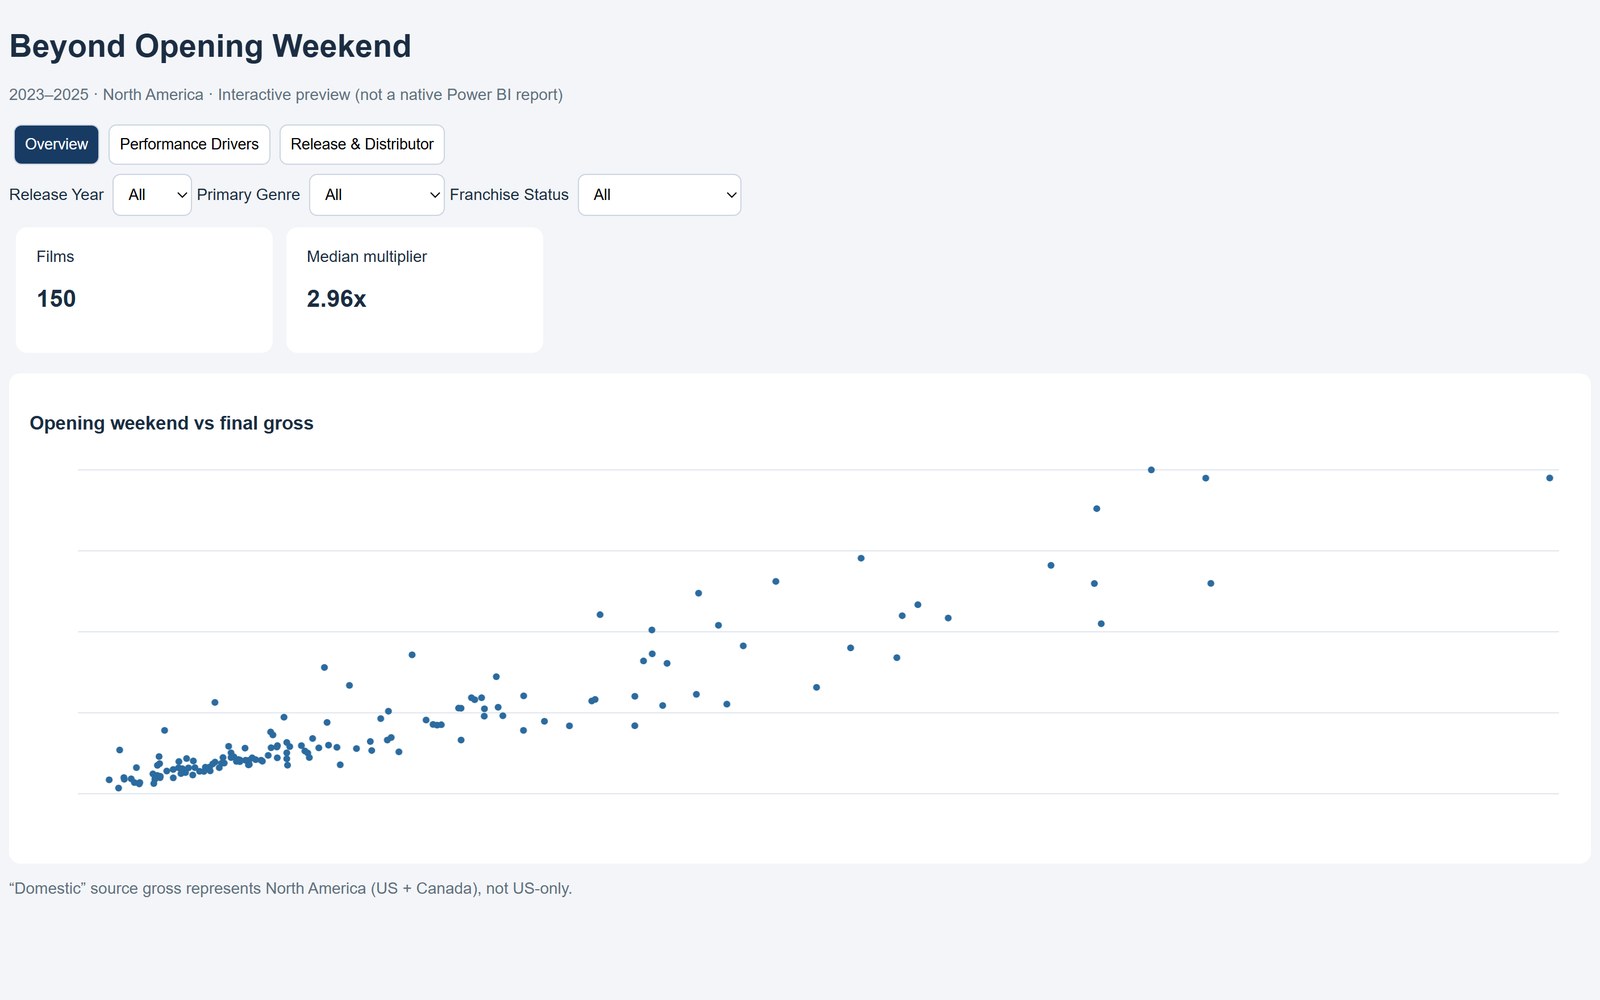
The reported Pearson correlation between opening-weekend and final North American gross is 0.928 in this sample. This describes an association rather than validated predictive performance. Final gross also includes opening-weekend revenue, so the two measures are partly related by definition.
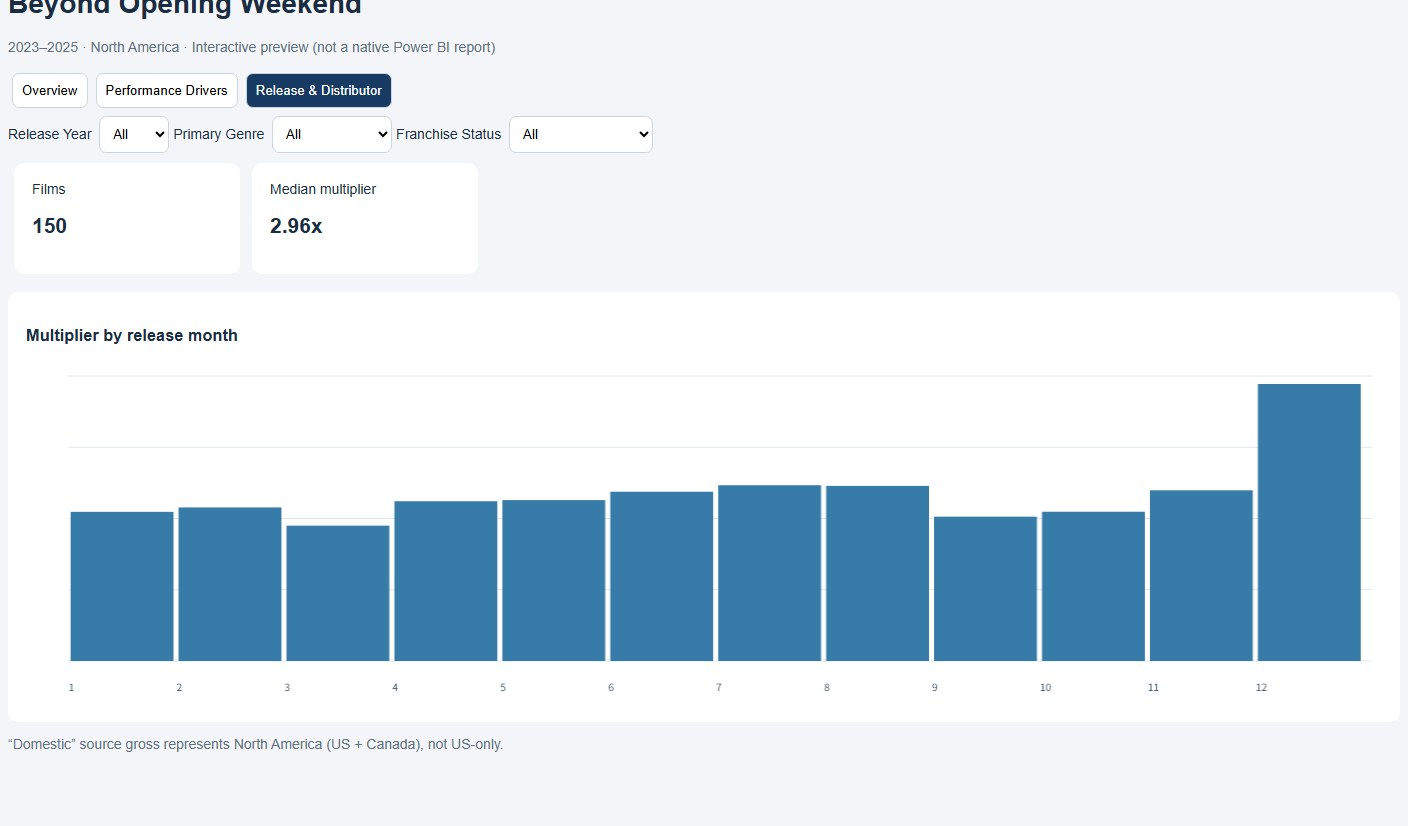
In the sample, franchise and IP films had a higher median opening, while non-franchise films had a higher median final-to-opening multiplier: 3.34× compared with 2.89×. December releases had a median multiplier of 5.08×. These differences may reflect several factors, including film selection and release conditions; they do not isolate the effects of franchise status or release month.
The six charts include units, sample information and a definition of the geographic scope to help readers interpret the comparisons.
From finding to decision 05
A useful interpretation needs to distinguish a descriptive result from a recommendation. The table below connects the reported findings to questions a film programmer or marketing team could investigate. It does not present tested release strategies.
| Finding in this sample | Question it raises | What it does not establish |
|---|---|---|
| Opening-to-final correlation: 0.928 | How much additional information is needed to describe revenue after opening weekend? | The accuracy of a forecast for an unseen film. Final gross already includes opening revenue. |
| Median multiplier: 3.34× for non-franchise films, 2.89× for franchise/IP films | Would comparable titles benefit from different expectations about the timing of audience demand? | That franchise status causes a shorter run, or that one group needs a specific marketing budget. |
| December median multiplier: 5.08× | How do holiday schedules and the mix of released films affect the comparison? | That moving a release to December would increase its gross. |
Why compare both gross and multipliers?
Gross measures scale, while the final-to-opening multiplier describes the relationship between the opening and the rest of the run. Using both helps separate a large opening from a relatively sustained run. A high multiplier is not, by itself, evidence of high revenue or profitability.
Further study 06
The next step would be to test whether the patterns remain useful beyond this selected sample. The following work is proposed, rather than completed.
- Check comparability. Report group sizes and distributions, and examine whether the franchise and month comparisons persist within more comparable release groups.
- Separate later revenue. Analyse gross earned after opening weekend to reduce the part–whole relationship between opening gross and final gross.
- Validate on other releases. If forecasting is pursued, define a baseline and test on releases not used to develop the model. Report errors and uncertainty rather than correlation alone.
- Connect to a real decision. Discuss an actual programming or marketing question with a practitioner and determine what additional cost, scheduling or audience information would be required.
Delivery and limits 07
Project materials
- Excel workbook with raw, cleaned and analysis sheets.
- Power Query M cleaning queries and DAX measure definitions.
- Power BI build guide plus a three-page interactive HTML preview.
- Executive summary, six charts and a portfolio write-up.
Limitations
- The sample is selected, not random; results describe these 150 films.
- “Domestic” means North America, not the United States only.
- No production or marketing costs are included, so the project cannot speak to profitability.
- Results are descriptive benchmarks, not causal forecasts.
- A native .pbix file is not part of the package; the report design is specified and previewed in HTML.